The Same Drive, Three PWM Strategies, Three Different Thermal Behaviors
This article is based on the official SIMBA example 44. Modulation Strategies Motor Drive, combining a 3-phase inverter, closed-loop DQ control, and a JMAG-RT PMSM model.
Abstract
Engineers often compare PWM strategies using a single criterion such as DC-bus utilization or inverter switching losses. That is not enough for a real drive. What matters thermally is not only how many watts are lost, but also where those watts are dissipated. Using the official SIMBA motor-drive example with a JMAG-RT PMSM, this article compares SPWM, SVPWM, and DPWM at identical operating points. At 4000 rpm, 20 Nm, and 20 kHz, SVPWM and SPWM remain close, 404.4 W and 407.8 W total losses, while DPWM rises to 454.6 W. The main gap comes from inverter switching losses, about 111 W for SPWM and SVPWM, versus 132.6 W for DPWM. The same example also shows that the thermal center of gravity moves with operating point: at 2000 rpm and 250 Nm, copper losses dominate, while at 4000 rpm and 20 Nm, iron losses and inverter losses take a much larger share. The practical lesson is simple: the best PWM strategy depends on what you are trying to optimize, and where your thermal margin is consumed.
1. The Real Question Is Not Which PWM Strategy Is Best
Most comparisons of SPWM, SVPWM, and DPWM stop at a familiar summary: - SVPWM gives better DC-bus utilization - DPWM may reduce switching activity in some regions - SPWM is the baseline reference
That framing is useful, but incomplete for drive engineers. A cooling plate, a junction-temperature limit, or a machine thermal constraint does not care about a modulation label. It cares about where the heat is generated.
The more useful engineering question is therefore this one:
At the same speed and torque target, does the PWM strategy change where the losses are dissipated across the drive system?
That question matters because it directly affects: - semiconductor thermal margin - cooling-system sizing - derating behavior - the trade-off between inverter-side and machine-side stress
2. Why System-Level Simulation Matters
This is difficult to answer from hand calculation alone because the relevant quantities are coupled: - semiconductor conduction losses - semiconductor switching losses - motor copper losses - motor iron losses - current control behavior - machine operating point
A modulation strategy can alter switching events and waveform quality without changing the commanded torque target. So the total loss may move moderately while the location of the dissipation moves much more.
This is exactly why a system-level model matters. The question is not simply Which strategy gives fewer switching losses?, but rather Which subsystem pays the thermal price for the chosen strategy?
3. SIMBA Setup
Figure 1 shows the actual SIMBA model used as the basis of the comparison.

The official example combines: - a 2-level 3-phase inverter - a closed-loop DQ controller - a JMAG-RT IPMSM model - electro-thermal semiconductor loss models
Main system data
| Parameter | Value |
|---|---|
| DC bus voltage | 600 V |
| Machine model | JMAG-RT IPMSM |
| Compared strategies | SPWM, SVPWM, DPWM |
| Switching frequencies in the example | 20, 40, 60 kHz |
| Operating point A | 2000 rpm, 250 Nm |
| Operating point B | 4000 rpm, 20 Nm |
Quantities compared in this article
| Quantity | Source in the example |
|---|---|
| MOS conduction losses | Average per-device SIMBA loss signals |
| MOS switching losses | Average per-device SIMBA loss signals |
| Motor copper losses | JMAG-RT average loss signal |
| Motor iron losses | JMAG-RT average loss signal |
All numerical comparisons below are taken from this official SIMBA drive example and should be interpreted as applying to this specific drive, operating point, control implementation, and modulation setup.
4. Same Drive, Same Operating Point, Different Thermal Behavior
We start with the high-speed light-load operating point, 4000 rpm and 20 Nm, at 20 kHz. This is where the loss redistribution is the easiest to see.
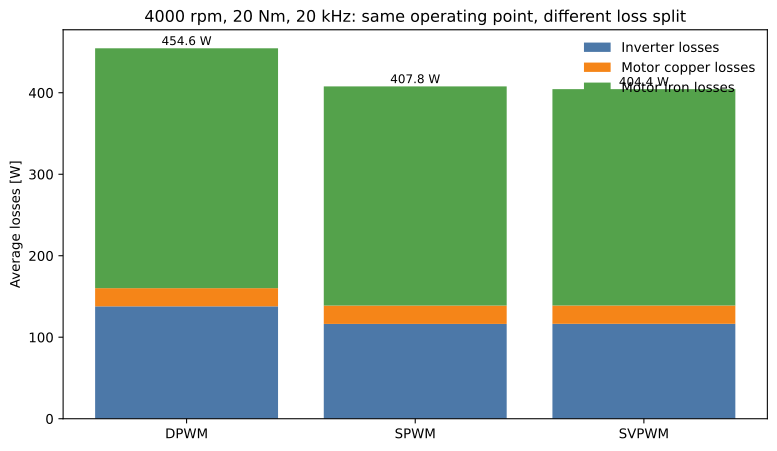
At this operating point: - SVPWM gives about 404.4 W total losses - SPWM gives about 407.8 W total losses - DPWM rises to about 454.6 W
The gap is not mainly caused by copper loss. It comes first from the inverter side: - SVPWM inverter losses: 116.5 W - SPWM inverter losses: 116.3 W - DPWM inverter losses: 137.9 W
Motor copper losses stay low and close in all three cases, around 22.3 to 22.5 W. The larger machine-side variation is in iron losses: - SVPWM: 265.5 W - SPWM: 268.9 W - DPWM: 294.3 W
So the key engineering result is not simply DPWM is worse or SVPWM is better. It is this:
At the same 4000 rpm / 20 Nm operating point, the PWM strategy changes where the heat is generated, and therefore changes what part of the drive consumes the thermal margin.
5. Why a 50 W Gap Can Matter
A difference of roughly 50 W in total losses may look modest when read as a single number. In a real drive, it often is not.
That extra heat can mean: - several degrees of additional semiconductor junction temperature - less margin before coolant or heatsink saturation - a tighter continuous-power envelope before derating - more difficult packaging if the inverter is already thermally dense
The same applies on the machine side. A strategy that looks acceptable from inverter efficiency alone may still move more heat into the motor through iron-loss increase.
This is why a single efficiency ranking is often the wrong output variable. The more relevant question is whether the extra watts are being dissipated where your design still has margin, or where it is already constrained.
6. Switching Losses Already Diverge at 20 kHz
At 4000 rpm and 20 Nm, the verified 20 kHz dataset already shows that switching losses are a major discriminator between strategies.
The extracted inverter switching losses are: - SPWM: 111.1 W - SVPWM: 111.2 W - DPWM: 132.6 W
So even without extending the discussion to higher switching frequencies, one practical conclusion is already solid:
for this operating point, modulation strategy cannot be treated as thermally neutral on the inverter side
That is enough to support a real engineering decision if the inverter is already the thermally constrained subsystem.
7. Where Does the Heat Go as the Operating Point Changes?
The most interesting result of the example is not the ranking at one point. It is that the dominant heat source changes when the drive operating point changes.
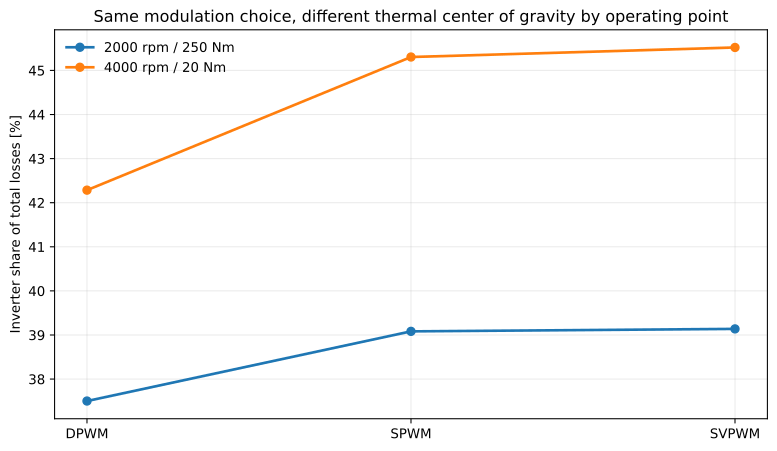
The official example compares two operating regions: - 2000 rpm, 250 Nm: high torque, lower speed - 4000 rpm, 20 Nm: low torque, higher speed
At 2000 rpm / 250 Nm, copper losses exceed 2 kW in the official example and become the dominant thermal contributor.
At 4000 rpm / 20 Nm, copper losses collapse to about 22.4 W, while iron losses and inverter switching losses become much more important.
This is the real system-level message: - at high torque, the drive is pulled toward copper-dominated thermal stress - at high speed and light load, the thermal center of gravity moves away from copper and toward iron plus inverter losses - the best PWM choice therefore depends on which subsystem is thermally critical in the region that matters most for the mission profile
A drive can keep the same architecture and still present a different thermal bottleneck depending on operating point.
8. What This Changes in a Real Design Review
For the cases investigated here, three takeaways are especially relevant.
8.1 There is no universally best PWM strategy
The right answer depends on what you optimize: - minimum inverter switching losses - minimum total drive losses - motor thermal relief - inverter thermal relief
8.2 SPWM and SVPWM are close in this specific case
At 4000 rpm and 20 Nm, SPWM and SVPWM remain very close in total losses and inverter losses. That means a decision between them should probably be made from the broader design context, not from this point alone.
8.3 DPWM is not thermally neutral
In the same case, DPWM adds about 21.4 W of inverter losses versus SVPWM, and about 50.1 W of total losses. Those two gaps are directly supported by the verified 20 kHz dataset used in Section 4. That is enough to matter if the inverter is the subsystem already closest to its thermal limit.
9. Want to Reproduce the Analysis?
The complete model is available in the official SIMBA Python example:
- 44. Modulation Strategies Motor Drive
It includes the SIMBA design, the JMAG-RT machine model, and the scripts used to compare modulation strategies over multiple operating points and switching frequencies.
10. Conclusion
The most useful conclusion from this drive example is not that one PWM strategy wins universally. It is that the same drive can display different thermal behavior at the same operating point depending on how the inverter is modulated. At 4000 rpm, 20 Nm, and 20 kHz, SPWM and SVPWM stay near 404 to 408 W total losses, while DPWM rises to 454.6 W. More importantly, the loss redistribution changes which subsystem pays the thermal price. Across operating points, the thermal center of gravity also moves between motor and inverter. For drive engineers, that means PWM strategy should be selected against a thermal objective and a mission profile, not against a single standalone efficiency number.
References
- Official SIMBA Python example:
44. Modulation Strategies Motor Drive, AESIM / Powersys. - Official SIMBA Python example:
43. Inverter Efficiency Map JMAG, AESIM / Powersys. - Buso, S., Mattavelli, P., Digital Control in Power Electronics, Morgan & Claypool.
- Erickson, R. W., Maksimovic, D., Fundamentals of Power Electronics, 2nd ed.
- JMAG-RT documentation, JSOL Corporation.
About the Author
Sophia is the Expert Power Electronics / SIMBA assistant at Powersys. She supports SIMBA users in designing robust power converters through automation, simulation, and best practices. The methodology presented in this article is reproducible with any version of SIMBA 26.x or later.


